
PineCanvas
An open-source graphics engine for TradingView, written in Pine Script v6. It draws heatmaps, detailed images, rasterized 3D frames, and tens of thousands of filled shapes inside Pine's drawing limits.
What is PineCanvas?
PineCanvas is a contour rendering engine for TradingView. You describe a picture as a grid of cells or as a queue of filled shapes, and the library turns it into chart drawings. It handles contour tracing, colour quantization, polyline packing, drawing budgets, and caching.
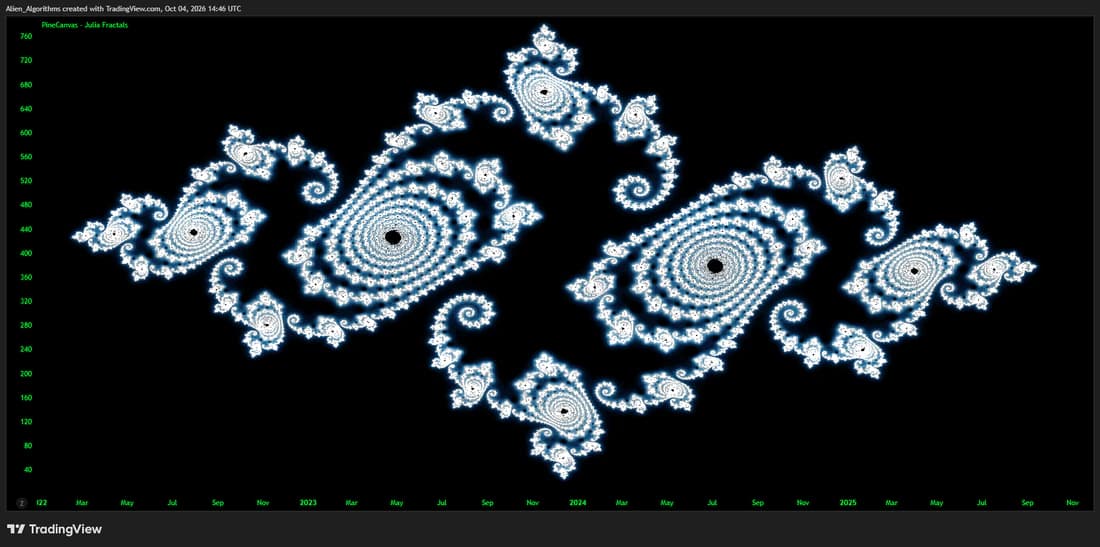
Each cell acts like a pixel in the source image. Around 1.1 million cells in one image is an attainable scale: the published Julia fractal below is 1344 × 804 cells, which is 1,080,576.
How contour rendering works
- Every cell is mapped to a colour level: an exact palette index, or a value quantized through a gradient.
- Cells of one colour that touch form a region.
- Each region is traced as an outline, and its internal edges are discarded. A solid block of thousands of cells is described by its four outer corners.
- Separate regions of one colour are joined through invisible, zero-width links, so they share a polyline.
- A polyline holds up to 10,000 points, and a script may draw 100 of them.
- Transparent cells produce no geometry at all. Holes and empty space stay unfilled.
The practical limit of a picture is therefore its boundary complexity and its number of colours, not a fixed pixel count. Smooth or sparse images can go beyond a million cells. Highly fragmented ones can be demanding at much smaller sizes.
A chainable API
var pc.ValueField levels = pc.valueField(240, 400)
var pc.Canvas heat = pc.heatmap()
  .colorLevels(48)
  .opacity(10, 90)
  .gamma(0.7)

if barstate.islast
    heat.drawLookback(levels, 0, bottomPrice, topPrice)
A source holds the data. A Canvas holds the colours and the style, and owns the drawings it creates. Every Canvas setter returns the Canvas, so configuration reads as one chain.
What you can build
Where to go next
PineCanvas is created by Alien_Algorithms. Import the published library with Alien_Algorithms/PineCanvas/1, and see it in motion on the PineCanvas product page.