
Filled Shapes
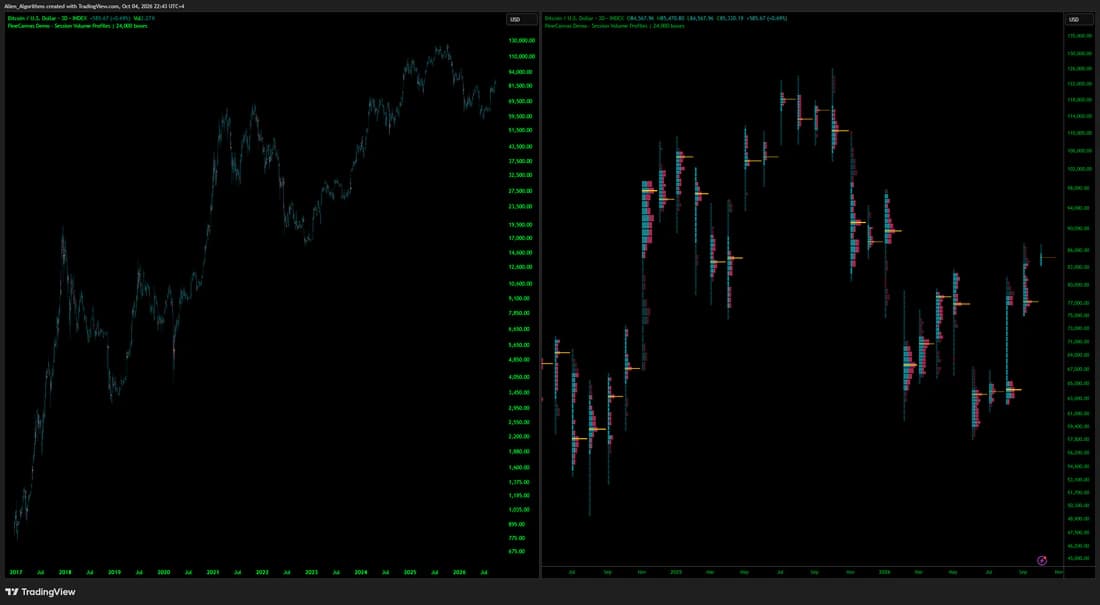
Not everything belongs in a grid. The Shape API queues rectangles, triangles, ellipses, and polygons in chart time and price, then packs every shape of one colour into shared polylines.
What the Shape API is
TradingView allows 100 polylines of up to 10,000 points each. Spending one drawing per filled shape stops at 100 shapes. PineCanvas joins many disconnected shapes of one colour into a single polyline, so a script can keep thousands of them on screen.
Queue, then draw
- Queue: each shape call adds one shape to the Canvas's queue and returns the Canvas. Nothing is drawn yet.
- Draw:
drawShapes()draws the whole queue, replaces the Canvas's previous drawings, empties the queue, and returns the number of polylines it used. - Repeat: on the next update, queue the shapes again and call
drawShapes()once.
| Call | Purpose |
|---|---|
drawShapes() | Draw the queue as the new frame. Returns the polylines created. |
clearShapes() | Discard the queue without drawing it. |
shapeCount() | How many shapes are queued and not yet drawn. |
The four shapes
// A rectangle from two opposite corners
canvas.rect(chart.point.from_time(leftTime, topPrice), chart.point.from_time(rightTime, bottomPrice), color.teal)

// A triangle from three corners, in any orientation
canvas.triangle(pointA, pointB, pointC, color.orange)

// An ellipse: centre, radius in milliseconds, radius in price, segments, colour
canvas.circle(chart.point.from_time(time, close), 3600000, 25.0, 48, color.aqua)

// Any closed polygon from 3 to 9,999 points, convex or concave
canvas.poly(points, color.purple)
rect(topLeft, bottomRight, fillColor)queues an axis-aligned rectangle.triangle(cornerA, cornerB, cornerC, fillColor)queues a triangle.circle(centre, radiusTime, radiusPrice, segments, fillColor)queues an ellipse approximated by a polygon of 3 to 9,999 segments. Its two radii use different units, so how round it looks depends on the chart's scale.poly(points, fillColor)queues an arbitrary closed shape from anarray<chart.point>, in either winding direction.
chart.point.from_index() has no time and is rejected with a runtime error.A complete example
//@version=6
indicator("PineCanvas - High Volume Zones", overlay = true,
  max_polylines_count = 100)
import Alien_Algorithms/PineCanvas/1 as pc
// Make sure to update to the latest library version

int lookback = input.int(100, "Lookback bars", minval = 20, maxval = 300)
float averageVolume = ta.sma(volume, 20)
var pc.Canvas zones = pc.newCanvas()

if barstate.islast and bar_index >= lookback + 19
    for column = 0 to lookback - 1
        int offset = lookback - 1 - column
        int leftTime = time[offset]
        int rightTime = offset > 0 ? time[offset - 1] : time + int(time - time[1])
        // Heavier volume draws more opaque, in four steps so the colours stay few
        int tier = int(math.min(3, nz(volume[offset] / averageVolume[offset]) * 2))
        color zoneColor = color.new(
          close[offset] >= open[offset] ? color.teal : color.red, 85 - 20 * tier)
        zones.rect(
          chart.point.from_time(leftTime, high[offset]),
          chart.point.from_time(rightTime, low[offset]),
          zoneColor)
    zones.drawShapes()
The example shades whole candle ranges, not their internal volume distribution. The current candle's right edge is estimated from the previous bar spacing. Opacity moves in four steps, not continuously, because every distinct colour needs its own drawing allocation.
Capacity
- One polyline holds about 1,600 four-corner rectangles of one colour.
- A queued batch accepts up to 100,000 source vertices, which is 25,000 rectangles.
- A batch may use up to 100 distinct fill colours.
- The number of polylines a batch takes depends on its colours and geometry, and is bounded by the Canvas's
drawingLimit().
Fewer distinct colours leave more room for shapes. Quantize continuous colour scales into a handful of steps before queueing.
Colours and overlap
- A batch is grouped by fill colour. Colours are drawn in the order they first appear in the queue.
- Overlapping shapes of the same colour form a union. The overlap does not get darker.
- Shapes are fills. Separate borders per shape and independent layering per shape are not part of the packed fill.
Time coordinates
Shapes are anchored to real chart times and prices, so they stay on their bars as the chart is panned or zoomed. Read a candle's own time when exact bar alignment matters.
pc.barsToTime(offsetBars) estimates the timestamp a number of bars ahead of, or behind, the current bar. It assumes evenly spaced bars on the current timeframe and does not account for session gaps, so use it for future positions and layout, not for aligning with past candles.
Shapes together with fields
A Canvas shows either its last field or its last shape batch, because each draw call replaces what that Canvas drew before. To show both, give each its own Canvas. Layers & Drawing Budgets covers the order they stack in and how they share polylines.