
Images & Pine3D Frames
A PaletteField is not limited to a few market-state colours. Every cell selects an exact palette entry, so a script can draw detailed pictures and fully shaded 3D frames.
Exact-colour pictures
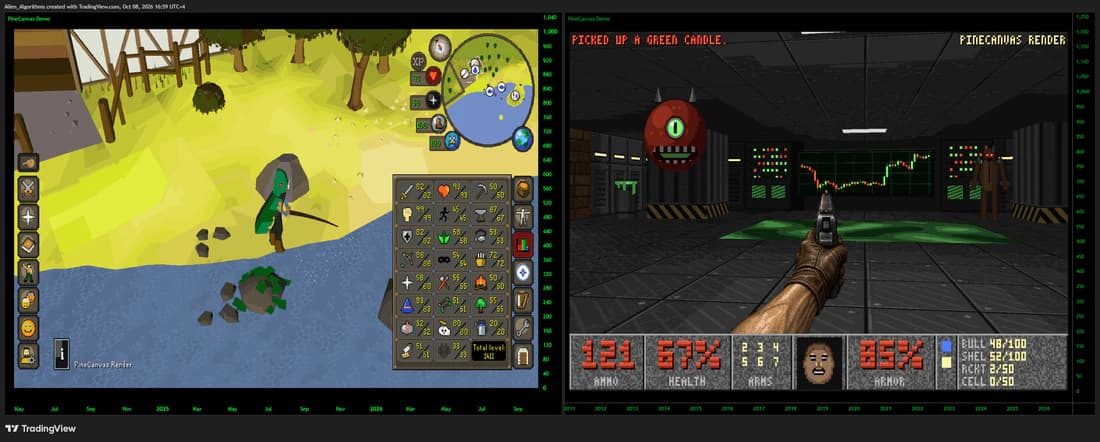
The calling script generates the picture: it decides the palette index of every cell. PineCanvas handles the palette, the filled contours, and the placement on the chart. Precise edges, fine shading, and transparent areas all come from the indices alone.
Building a palette
- A palette is the Canvas's colour array, with 2 to 100 entries. Index 0 is the first entry.
- Pass it to
pc.newCanvas(colors), or set it later withcanvas.palette(colors). - Entries can carry their own transparency through
color.new(). - Each colour that appears in the picture needs at least one polyline, so 100 colours leave no room for other canvases.
var array<color> colours = array.from(#0b132b, #1c2541, #3a506b, #5bc0be, #ffffff)
var pc.Canvas canvas = pc.newCanvas(colours)-1or an index below the palette's size. An index beyond it stops the script with an error that names the valid range.Writing a picture
For anything beyond a few thousand cells, write through a row view instead of calling set() per cell. row() returns the field's own storage for that row.
array<int> target = picture.row(row)
for column = 0 to picture.columns - 1
    target.set(column, paletteIndexAt(row, column))
A large picture takes more than one bar's worth of work. Writing one row, or a few rows, on each historical bar and drawing once at the end keeps every loop short. Performance & Large Images shows the pattern.
Transparent backgrounds
Leave background cells at -1. They add no geometry and the chart shows through them. A large picture with a smooth, opaque background is far more expensive than the same picture on a transparent one, so put a backdrop on its own coarser Canvas when you need it.
Pine3D frames
Pine3D builds the meshes, the camera, and the lighting. Its rasterize() call writes the finished frame straight into a palette field's storage and returns the shades it used. PineCanvas takes those shades as its palette and draws the field.
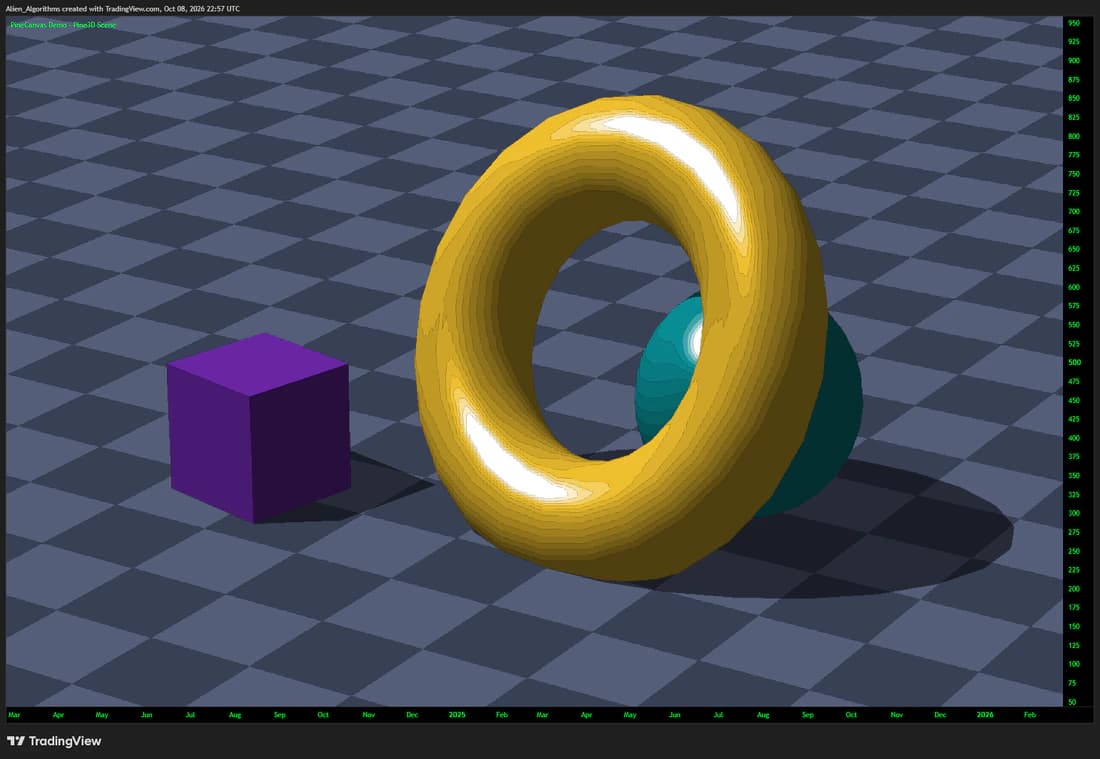
//@version=6
indicator("Pine3D with PineCanvas", overlay = false, max_polylines_count = 100)
import Alien_Algorithms/Pine3D/5 as p3d
import Alien_Algorithms/PineCanvas/1 as pc
// Make sure to update to the latest library version

var p3d.Scene scene = p3d.newScene()
var pc.PaletteField frame = pc.paletteField(240, 384)
var pc.Canvas canvas = pc.newCanvas()

if barstate.isfirst
    scene.add(p3d.cube(60.0, color.orange))
    // The floor: grid() faces down, so it is turned over
    scene.add(p3d.grid(600.0, 600.0, 8, 8, #3a4258).rotateTo(180.0, 0.0, 0.0).moveTo(0.0, -30.0, 0.0))
    scene.camera.orbit(35.0, 25.0, 180.0)
    scene.setLightDir(-0.7, -1.0, -0.3).setAmbient(0.25).setShadowStrength(0.6)

if barstate.islastconfirmedhistory and bar_index >= 384
    array<color> shades = scene.rasterize(frame.band(0), 384, 240, shades = 16, zoom = 2.4)
    canvas.palette(shades)
canvas.drawLookback(frame, 0, 0.0, 240.0)- The field is the frame buffer. 240 rows and 384 columns give a 384 × 240 frame.
- rasterize() fills a band. It is handed
frame.band(0), the field's first storage band. - The shades become the palette.
canvas.palette(shades)must run before the draw call. - The frame is drawn once.
barstate.islastconfirmedhistoryrenders it when the chart finishes loading.
Larger frames
The 384 × 240 frame fits in one storage band. A larger frame is split across bands, and each band is rasterized on its own, with the row it starts at.
// W, H, SHADES and ZOOM are the script's own constants
var pc.PaletteField frame = pc.paletteField(H, W)
var pc.Canvas canvas = pc.newCanvas()
var array<color> palette = na
var int bandsDone = 0
var bool rendered = false

// How far this bar is from the chart's last bar
int remaining = last_bar_index - bar_index

// One band on each of the last few bars
if remaining >= 1 and remaining <= frame.bandCount() + 2 and bandsDone < frame.bandCount()
    palette := scene.rasterize(frame.band(bandsDone), W, H, frame.bandStart(bandsDone), SHADES, ZOOM)
    bandsDone += 1

// The frame, once, when every band is filled
if barstate.islastconfirmedhistory and bandsDone == frame.bandCount() and not rendered
    canvas.palette(palette)
    canvas.drawLookback(frame, 0, 0.0, float(H))
    rendered := true
Spreading the bands over consecutive bars gives each one its own share of Pine's execution time. The frame is drawn only when every band is filled, and the chart needs more bars than the frame is wide.
Aspect ratio
Cells are as wide as bars
With one bar per column, a cell's width is one bar and its height is (top - bottom) / rows in the pane's units. A picture looks right when the pane's zoom makes those two visually equal, so the proportions change as the chart is stretched.
Keep the frame in view
Draw between 0 and the row count, and add two invisible plots at those values so the pane always shows the full height of the picture. Placement & Coordinates has the snippet.