
Heatmaps on Price
A heatmap places numbers across time and price, turning levels and changes into visible bands over the candles. Your script owns the model. PineCanvas colours it and puts it at real price levels.
The pattern
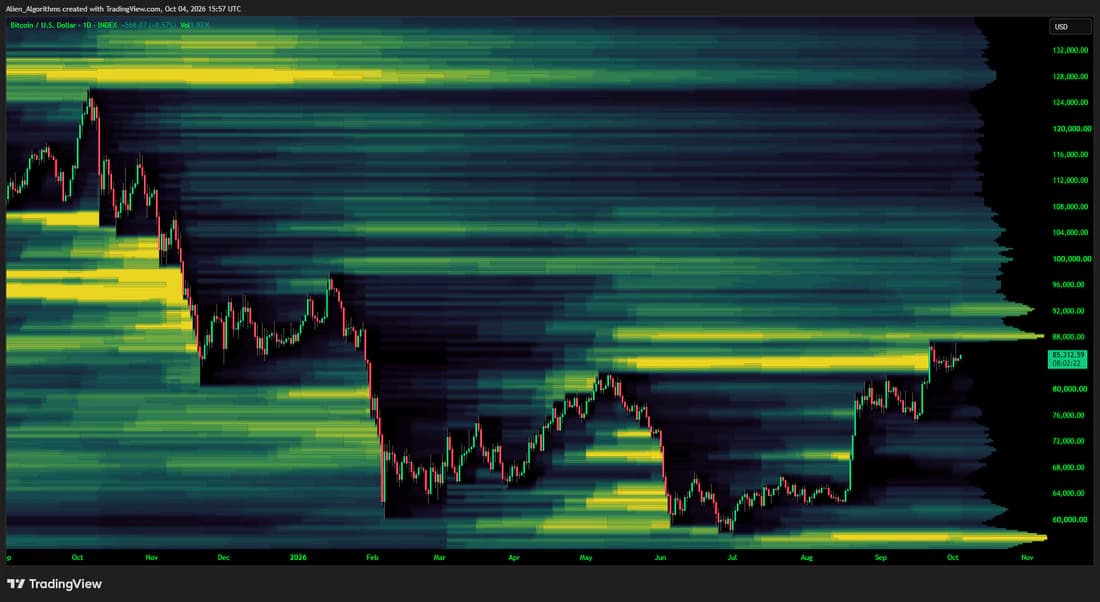
The published liquidation heatmap models leveraged exposure from price and volume, spreads it across leverage levels, fades older positions, and removes a level once price crosses it. All of that belongs to the indicator. The library receives a grid of numbers and draws it.
// The calling script computes estimatedExposure, chooses row and column
// indices, and supplies its own price bounds.
var pc.ValueField levels = pc.valueField(240, 400)
var pc.Canvas heat = pc.heatmap()
  .colorLevels(48)
  .opacity(10, 90)
  .gamma(0.7)

// For each calculated level:
levels.set(row, column, estimatedExposure)

// After the model has populated the field:
if barstate.islast
heat.drawLookback(levels, 0, bottomPrice, topPrice)- Columns are bars. Column 0 is the oldest bar of the window and the last column is the current bar.
- Rows are price levels. Row 0 starts at the bottom price.
- The bounds are prices. With
overlay = truethe picture lands on the candles it describes.
From price to row
Choose the price range the map covers, divide it into rows, and convert each price to a row index.
float rowHeight = (topPrice - bottomPrice) / rows
int row = int(math.floor((price - bottomPrice) / rowHeight))

if row >= 0 and row < rows
    levels.set(row, column, value)
Prices outside the range fall outside the field, so check the index before writing. A little padding above the highest high and below the lowest low keeps the outermost levels on the map.
A complete example
//@version=6
indicator("PineCanvas - Traded Range Heatmap", overlay = true,
  max_polylines_count = 100, max_bars_back = 500)
import Alien_Algorithms/PineCanvas/1 as pc

int columns = input.int(200, "Window (bars)", minval = 20, maxval = 400)
int rows = input.int(80, "Price rows", minval = 10, maxval = 200)

// Stateful series calculations must run on every bar.
float windowLow = ta.lowest(low, columns)
float windowHigh = ta.highest(high, columns)

var pc.ValueField field = pc.valueField(rows, columns)
var pc.Canvas heat = pc.heatmap().colorLevels(32).opacity(10, 85)

if barstate.islast and bar_index >= columns and windowHigh > windowLow
    float rowHeight = (windowHigh - windowLow) / rows
    field.fill(na)
    for column = 0 to columns - 1
        int back = columns - 1 - column
        // The rows this candle traded through
        int lowRow = math.max(0, int(math.floor((low[back] - windowLow) / rowHeight)))
        int highRow = math.min(rows - 1, int(math.floor((high[back] - windowLow) / rowHeight)))
        for row = lowRow to highRow
            field.set(row, column, nz(volume[back]))
    heat.drawLookback(field, 0, windowLow, windowHigh)
Each bar of the window fills the rows between its low and its high with its volume. The field is cleared with fill(na) and rewritten on each update, because the window and its price range both move. It is a starting point for any model that assigns a number to a bar and a price.
Colour control
colorLevels()picks 2 to 100 gradient levels. Around 32 to 64 reads as continuous while keeping regions large.opacity(low, high)sets how visible weak and strong values are. A low first value lets the chart show through the quiet areas.gamma()controls how strongly the weaker values show. Below 1 lifts them. Above 1 hides them.pc.heatmap(pc.gradient(...))swaps the default thermal gradient for your own stops.
Stable colours
pc.heatmap() scales automatically: the strongest value in the grid always takes the brightest colour. That reads well as a single picture, and it means the same number can change colour from one update to the next.
Keep a colour tied to a value
Call valueRange(minimum, maximum) with bounds you choose, for example a multiple of average volume. Values above the maximum are drawn at the top level.
Compare within a bar or within a level
autoScale(pc.ScaleMode.eachColumn) scales every bar on its own, which shows where each bar's activity sat. autoScale(pc.ScaleMode.eachRow) scales every price level on its own.
A transparent floor
Most of a heatmap is usually close to zero. Writing na for values under a threshold leaves those cells transparent, which removes the largest region of the picture and keeps the chart readable.
levels.set(row, column, value >= floorValue ? value : na)When to redraw
A heatmap that depends on closed bars only needs to redraw when a bar closes.
bool redraw = barstate.islastconfirmedhistory or
  (barstate.isrealtime and barstate.isconfirmed)

if redraw
    // rebuild the field, then draw it
    heat.drawLookback(levels, 0, bottomPrice, topPrice)
Drawing inside barstate.islast instead updates on every tick. When nothing in the source, style, or placement changed, PineCanvas skips the redraw, so only real changes cost a render.
ValueScroll does the bookkeeping for you. See Rolling Sources.Behind the candles
To put a heatmap behind the price candles, right-click the indicator on the chart, open Visual Order, and choose Send to Back.
Alien Algorithms' open-source Liquidation Heatmap indicator is drawn with PineCanvas. It estimates liquidation levels from Open Interest changes and groups them into price zones.